Student Usage Reports - Are Students Engaged?
In this section:
Overview on Views and EchoCenter Analytics
For an overview of how EchoCenter Analytics are calculated and displayed, please visit: Overview of Views and EchoCenter Analytics
Content Engagement
EchoCenter content engagement analytics allow you to improve your teaching in these ways:
- You can identify students who may be falling behind
- You can identify students who are working diligently
You can also use engagement analytics as part of a broader analysis.
- You can export all student data to a .csv file that can be opened and manipulated in Excel or another spreadsheet program. This allows for integrated analysis: You can combine the engagement analytics with data from other academic systems, such as learning management systems, homework applications or e-portfolios. Doing so provides a more complete picture of student engagement.
- You can include lecture review in course assessment. In a distance learning course, for example, you might use participation in LMS-based discussions as an input when calculating a student's attendance score. You could also include lecture review as another input. Students can raise their attendance score by diligently reviewing every Echo.
Two different EchoCenter reports give you these insights:
- The student aggregate report
- The student detail report
The Student Aggregate Report
Overview
As an Instructor, you try to assess each student's learning experience:
- Did he attend every class meeting?
- Did she seem to be paying attention in class?
- Did she ask questions that either demonstrated understanding or sought clarification?
Engagement analytics give you data on what students are doing outside of the class.
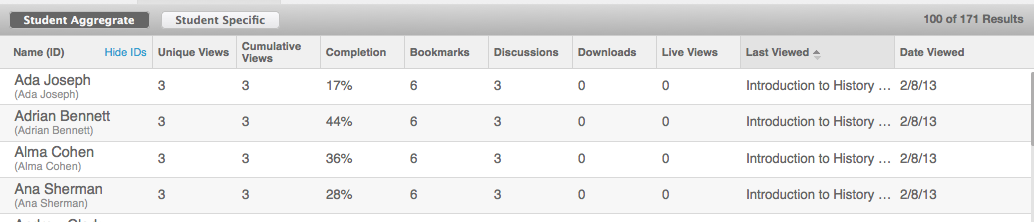
The student aggregate report shows engagement data for each student in a section. For each student you see these parameters.
- Name (ID). This parameter shows the student name in first name, last name, format. It may also show additional IDs.
- Unique Views. This parameter is the number of different Echoes the student has viewed. For example, if you have presented 12 lectures (and every lecture has been made into an Echo), then a diligent student would show 12 in this field, indicating that he has viewed each lecture once. In general, a higher number indicates higher engagement.
- Cumulative Views. This parameter is the total number of Echoes the student has viewed. Continuing with the example given above, if your diligent student viewed each Echo twice, this field would show 24. In general, a higher number indicates higher engagement.
- Completion. This parameter is the amount of the Echo that was viewed. A student who watches every scene of an Echo generates a completion rate of 100% for that Echo. This parameter is the average completion rate for all Echoes viewed. In general, a higher number indicates higher engagement.
- Bookmarks. This parameter is the number of bookmarks posted for all Echoes. In general, a higher number indicates higher engagement.
- Discussions. This parameter is the number of discussion topics posted for all Echoes. In general, a higher number indicates higher engagement.
- Downloads. This parameter shows if the student downloaded Echoes (to an iPod, iPad, or laptop), as opposed to watching Echoes streamed in the EchoPlayer. If a student has downloaded an Echo, his interactions are not collected. This means that many parameters may be unusually low, seeming to indicate that the student is disengaged. This may not be so. See Students Who Download Echoes Have Skewed Data for details.
- Live Views. This parameter is the number of times a student has attended a live webcast as opposed to attended the class in the classroom.
- Last Viewed. This parameter, in conjunction with the Date Viewed parameter, can help you detect either a diligent or disengaged student. A diligent, engaged student views each Echo soon after it is posted. A less engaged student shows a bunching pattern, viewing many Echoes for the first time just before an exam.
- Date Viewed. This parameter is the date a student last viewed any Echo. In conjunction with the Last Viewed parameter, it can help you detect either a diligent or disengaged student.
Students Who Download Echoes or Use Mobile Devices Have Skewed Data
Think Before You Conclude. If a student shows low numbers for the first six parameters listed (Unique Views, Cumulative Views, Completion, Last Viewed, and Date Viewed), you might conclude that she is not engaged. Before drawing that conclusion, look at the Downloads parameter. A student may have downloaded many Echoes and be diligently viewing them, but these activities will not be reflected in the first six parameters.
Is the Student Using a Mobile Device? If usage information is not appearing at all for a student, or minimal usage information appears, find out how the student is consuming the Echoes. The EchoSystem collaboration service is not able to collect information from mobile players at this time, so those views are not being tracked. This is slated to be addressed in a future release.
Why is the Data Skewed Like That? When a student views an Echo via the full EchoPlayer (via desktop or laptop), the EchoSystem Server (ESS) can collect the parameters listed above. When a student downloads an Echo, or views an Echo from a mobile device (phone or tablet), communication with the ESS is hindered and no such data can be collected. Because it is not collected, the parameters for the student are low.
Therefore. Consider the Downloads parameter and mobile viewing possibility before drawing conclusions about a student's engagement.
View the Student Aggregate Report
- Navigate to the EchoCenter page for the section.
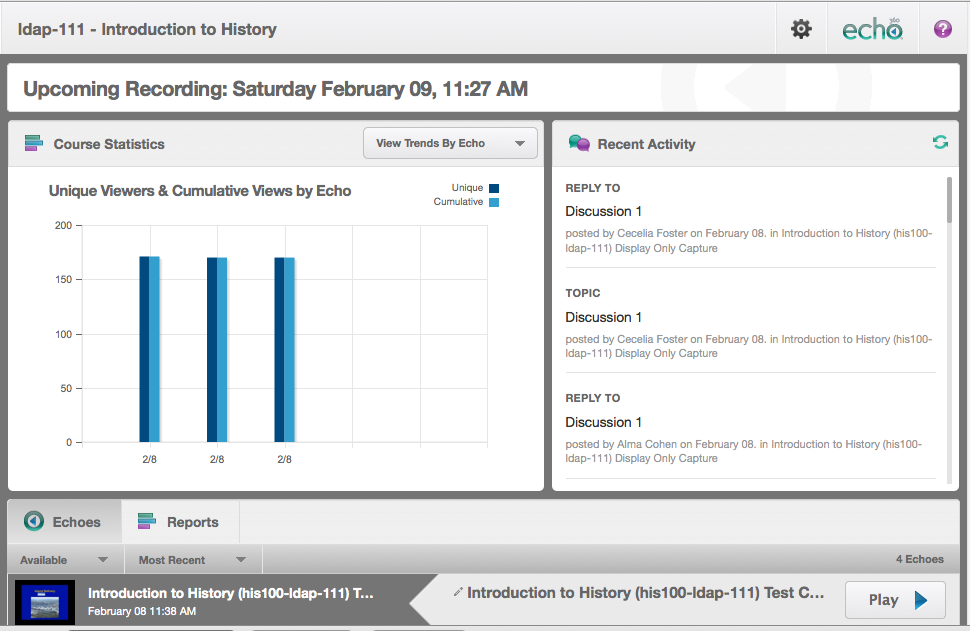
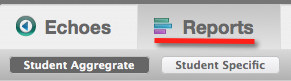
- Click the Reports tab.
- Review the student aggregate report, which is shown by default.
Explore the Report Features
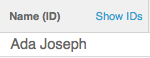
Hide or Show Additional IDs
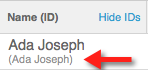
The report always shows students names as first name, last name ("Carlos Garcia"). Additional IDs, shown in parentheses under the EchoCenter ID, are those used in other systems, such as a learning management system (BlackBoard, Moodle) or a grading report system. These systems may use different name formats for the same student. ("cgarcia" instead of "Carlos Garcia"). Showing the additional IDs allows you to integrate data from engagement analytics with data from other systems.
If you do not want to reconcile data with other systems, we recommend hiding the IDs. This makes the report easier to read.
Sort Columns to See Maximums and Minimums
You can sort most columns by clicking on the column heading.
A few columns are not sortable, but you can export a report and manipulate the data in Excel or another spreadsheet program. See Export to a Spreadsheet.
Navigate through the Report
If the report contains more names that can be displayed on a single page, it is divided into pages. Use the page icons at the bottom of each page (or the Forward and Backward arrow buttons) to navigate through the report.
Adjust the Number of Names Per Page
Click the control at the bottom of the report to adjust the number of names shown on the page. The more names you show on each page, the fewer pages in the report.


Export to a Spreadsheet
Exporting data to a spreadsheet allows for integrated analysis, as described in the Overview.
Both the student aggregate report and the student specific report are exported.
- The student aggregate report (student-usage-aggregate.csv) shows the same student aggregate data as you see on the EchoCenter page.
- The student specific report (student-usage-specific.csv) shows specific data for every student. This is different from what you see on the EchoCenter page. On the EchoCenter page, the student specific report shows detailed data for a single student.
Follow these steps. This procedure shows the steps for a Macintosh. The procedure is similar for Windows.
- Click the Export button.

- The reports are prepared, compressed into a zip file, and exported. Notice that the Export button changes, as shown below, to indicate the export is in progress.
- When the reports are ready, you see the open/save dialog box, as shown below.
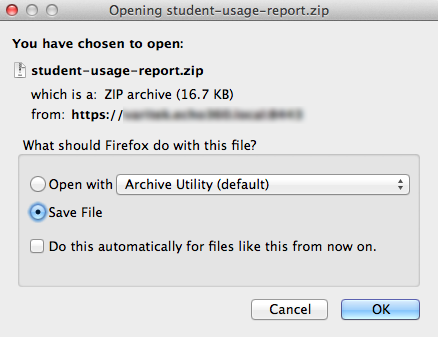
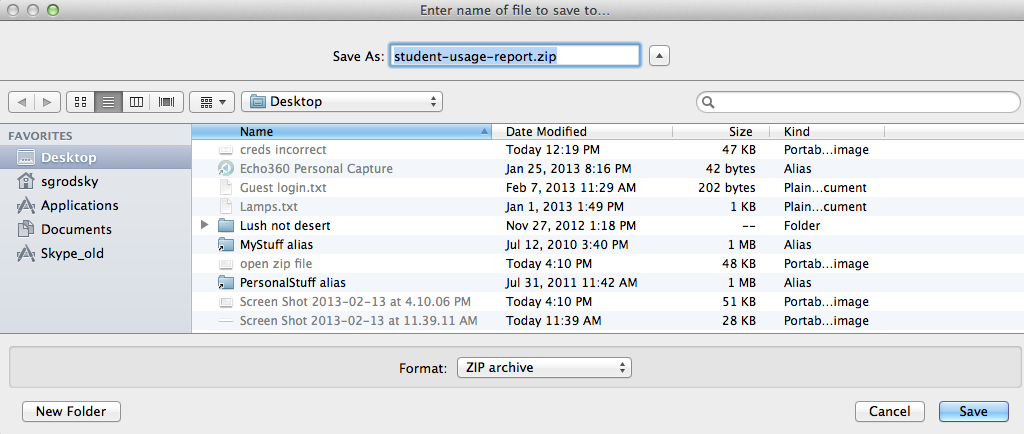
- Either open the report or save it. In this example, we save the report to the desktop, as shown below. Notice that the report is a zip file.
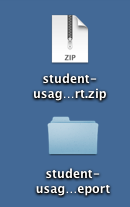
- Expand the zip file. You see both the zip file and the individual files in a separate folder, as shown below.
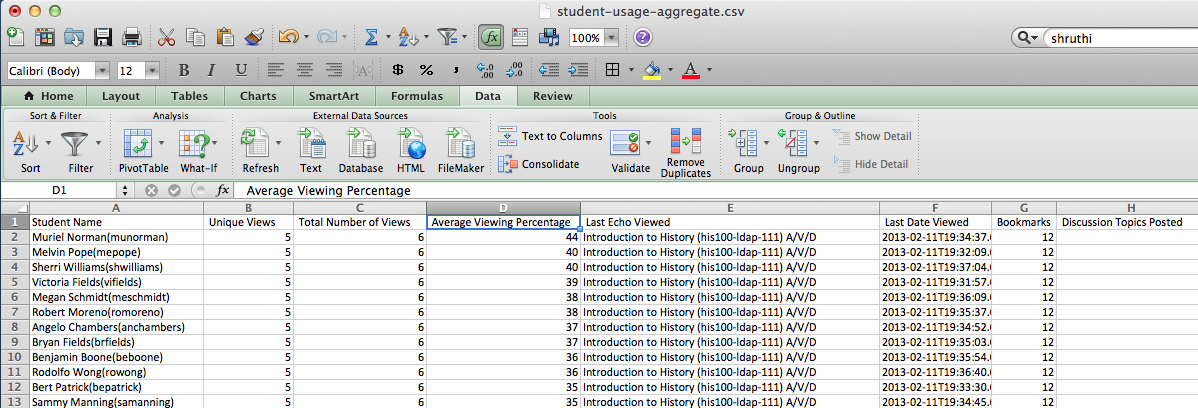
- Open the folder, then open either report and manipulate the data as you wish. In this example we opened the student aggregate report and sorted the Average Viewing Percentage parameter.
Navigate to the Student Specific Report
- Click on a student name.
- The student specific report for that student opens.
The Student Specific Report
Overview
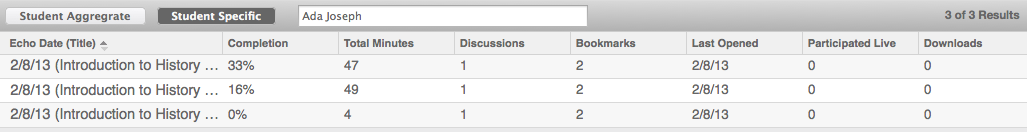
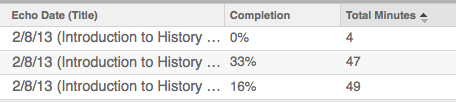
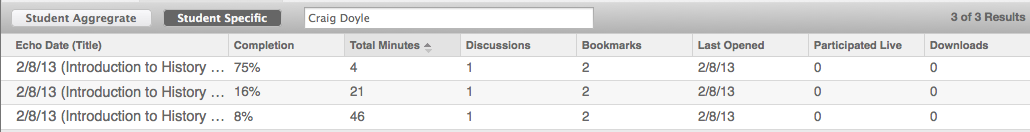
The student specific report shows student interaction with a particular Echo. For each student and each Echo you see these analytics:
- Echo Date (Title). This parameter is the title of the Echo and the date it was recorded.
- Completion. This parameter is the amount of the Echo that was viewed. A student who watches every scene of an Echo generates a completion rate of 100% for that Echo. In general, a higher number indicates higher engagement.
- Total Minutes. This parameter is the total minutes viewed. In general, a higher number indicates higher engagement.
- Discussions. This parameter is the number of discussion topics posted for the Echo. In general, a higher number indicates higher engagement.
- Bookmarks. This parameter is the number of bookmarks posted for the Echo. In general, a higher number indicates higher engagement.
- Last Opened. This parameter is the date the Echo was last viewed. In general, a recent view date indicates higher engagement.
- Participated Live. This parameter shows if the student attended a live webcast as opposed to attending the class in the classroom.
Downloads. This parameter shows if the student downloaded the Echo (to an iPod, iPad, or laptop), as opposed to watching the Echo as it is streamed in the EchoPlayer. If a student has downloaded an Echo, his interactions are not collected. This also applies if the student is viewing echoes on a mobile device. This means that many parameters may be unusually low, seeming to indicate that the student is disengaged. This may not be so. See Students Who Download Echoes Have Skewed Data for details.
View the Student Specific Report
- Navigate to the student specific report by using one of the methods below:
- Navigate from EchoCenter page:
- Click on the Reports tab.
- Click on the Student Specific Report button.
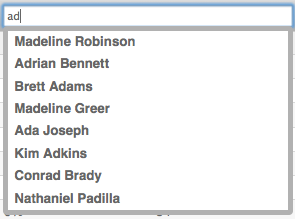
- Enter the name of the student.
- From the student aggregate report, click the name of the student.
- Review the student specific report. You can sort columns, export the data, and navigate through this report as you can with the student aggregate report. See Explore the Report Features.