...
If you are: | You: |
|---|---|
The System Administrator | See every tab and all information on the tabs. As the System Administrator, you are, by definition, associated with the parent organization |
An Administrator for the parent organization | See every tab and, in each tab, information on tasks related to all organizations |
An Administrator for a child organization | See every tab and, in each tab, information on tasks related to your organization |
A Scheduler (for either the parent or a child organization) | See only the Summary and Processing Tasks tabs |
Academic Staff | Cannot see the Monitor tab |
...
- Navigate to Monitor > Summary. The Summary tab appears, as shown in the figure below.

- Review the System Alerts, Capture Stations, Media Processors, and System Status information at the top of the page.
- Click any number in the summary statistics to link to detailed information about it. For example, clicking the number of registered capture stations opens the Devices page within the Configuration tab, where you can view, edit, upgrade, or retire those capture stations.
- Review the System Status column to see the status of storage volumes.
- Disk space is CRITICAL when a volume has 10 GB (10240 MB) or less of unused storage space
- Disk space is LOW when a volume has 30 GB (30720 MB) or less of unused storage space
...
- Navigate to Monitor > Summary. The Summary tab appears.
View the Recent Captures area below the summary statistics, shown in the below figure.
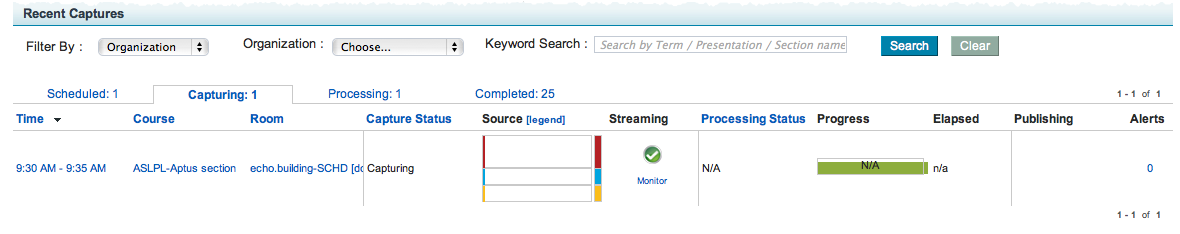
All recent captures appear on one of four tabs: Scheduled, Capturing, Processing, or Completed, as defined in the table below.
Capture State
Definition
Scheduled
A capture that has been scheduled for later today.
Capturing
A lecture that is currently being captured.
Processing
A capture or media import that is being processed and packaged for use.
Completed
A capture that has completed processing and has been published to the selected publisher(s).
- Find the capture you want to monitor. You can do that in either of the following ways.
- Search for a capture that meets the search criteria you enter.
- Browse the captures by state by clicking the relevant tab as described in the table above.
Review the status of the capture. The following table explains each element of the capture's status.
Status Element
Definition
Time
Start and end time of the capture
Course
The Course Identifier associated with a course in the system
Room
Physical location where the capture occurs
Capture Status
Displays the status of the capture of the lecture or external media import. Options are Waiting, Uploading Files, Capturing, Succeeded, Failed, and Missed.
A capture that is Failed or Missed will be listed for seven days, then deleted.Info title Missed Captures A missed capture is a scheduled capture that did not start capturing. A capture might be missed if there is not a device in the room, if the scheduled capture was not transmitted to the device in time for the capture to actually start, or a power outage occurred. The System Administrator can troubleshoot a missed capture by monitoring the device and confirming that it is licensed.
Source
Shows the status of the video, display, and audio signals associated with the capture. The following image explains the color coding of the signal status.

Info The source signal graph only shows the status of the latest 60-minute block of the capture, in one-minute intervals.
Streaming If a currently capturing item is a live webcast, the Streaming column provides an icon to indicate whether the expected input is streaming properly, and provides a Monitor link that allows you to open the student view of the webcast to see what is being broadcast in real-time. Processing Status
Displays the status of the processing of the capture, which involves packaging the capture into a form that a student, for example, can experience. Options are Succeeded, Failed, License Expired, or Cancelled.
Info title About the Succeeded Status It is possible for a capture's processing status to display Succeeded even when the source signal graph shows areas of problems with a source signal. The processing status complements the source signal graph. Succeeded indicates that some signal was successfully captured. Problems in the source signal highlight portions of the captured media that may not have captured the desired content. For example, if the Audio Signal shows as Not Present, perhaps because the microphone was unplugged, the capture's processing status would show as Succeeded but the captured media may have an audio dropout.
Progress
Displays the percent complete of the processing step.
Elapsed
Time in hours, seconds, and minutes since processing began.
Publishing
If the capture is scheduled to be published, this field shows the name of each publisher (such as RSS or Email) and its status: Success (
 ), Pending (
  ), Retry (
  ), and Failure (
  ).
).Alerts
Number of times this capture has raised a publishing alert.
Info title Sort the list of captures You can sort the list of captures for a selected capture state tab by clicking the column name.
Note title Elapsed Processing Times Please be aware that in situations where jobs are processed back-to-back, the Elapsed column on the Monitor >Summary page will report incorrect values.
Monitor Capture Status
| Insert excerpt | ||||||
|---|---|---|---|---|---|---|
|
...
- Navigate to Monitor > Captures.

- Find the Echo or media import. You have several choices for finding a capture. Options include the following.
- Click the All tab and search for a capture by entering a term in the Keyword Search box and then clicking Search.
- Click the All tab and filter the list of all captures by Date, Course, Presenter, or Room. Select one of these options from the Filter list, optionally enter a date, and then click Search.
Filter the list of all captures by clicking the Scheduled, Capturing, Processing, or Completed tab. Each tab corresponds to a capture state. A list of only those captures in the selected state appear.
Info title Sort the List of Captures You can sort the list of captures for a selected capture state tab by clicking the column name.
- Check the status of the capture by viewing the summary in the capture list. Click the capture name to view the detailed status about the capture, including its history as reported in the system log and full log.
...
- Navigate to Monitor > Captures.
Click the name of the capture in the Title column. The Capture Details page appears, as shown in the figure below.

The following table explains the information on this page.Field
Description
ID
The unique identifier for the capture. Click this link to view the processing log in a new browser window.
Title
The capture title that the system or the user provided
Room
Complete location of capture including campus, building, and room
Start Time
The time when the capture began
Presenter
The name(s) of the Presenter(s) that the user provided
Presentation ID(s)
The unique identifier of the processed echo. Click this link to view details about this echo.
Section
Term, Course and Section IDs
Status
This capture status
Duration
The length in time of the capture
Task ID
The unique identifier for the processing task
Task Created
The time when the processing task began
For additional details about this capture, view one of the logs. Click the System Log button to view the details about the processing of this specific capture. Click the Full Log button to view the complete history of the capture from the time it was scheduled to the time publishing is complete. Both logs open in a new browser window.
Info title Sort the List of Captures You can sort the list of captures for a selected capture state tab by clicking the column name.
...
| Insert excerpt | ||||||
|---|---|---|---|---|---|---|
|
On the Processing page, you can see the captures currently being processed and in the queue for processing. In addition to viewing the details of the task in either list, you can prioritize (raise or lower the priority in the list) or cancel the tasks for the ESS in the Queued to be Processed list.
...
- Navigate to Monitor > Processing Tasks. The Processing Tasks page appears. You can do the following on this page.
View information about each capture that is being processed or in the queue for processing. The following table explains this information.
Field
Description
Title
Name of the capture being processed or in the queue for processing
Processor
The MAC of the media processor assigned the processing task
Pri.
Priority of the capture that is determined by the user. The default, which you may change, is Normal. Options are Low, Normal, and High. Note that you can raise or lower the priority of a capture by hovering your mouse over a capture to highlight it, then clicking raise or lower, as shown in the following figure.

Click cancel to cancel the processing of this task.Task Created
The date and time when the recording of the capture ended and processing began.
Next Retry
If the media processors are busy or the media files are uploading, the system enters a time in this field. The default is ASAP.
Capture Start
The date and time when the recording of the capture began.
Duration
The length of time of the capture that is in the queue to be processed.
Room
The room where the capture was recorded
- Click the capture title to view details about that capture.
Change the priority or cancel the processing task. To do so, hover your mouse over a capture to highlight it. Click the raise button to increase the priority of the processing task, the lower button to decrease its priority. Click the cancel button to remove it from the list and either stop all processing tasks in progress or remove those tasks from the processing queue.
Info title Sort the List of Processing Tasks You can sort the list of processing tasks by clicking the column name.
...
Navigate to Monitor > Personal Capture. The Personal Capture Devices page appears as shown in the below figure.

The following table explains the fields.
...
- Navigate to Monitor > Notifiers. The Notifiers page appears.
- Click Add. The Add Notifier page appears, as shown in the following figure.

- Enter a name for the notifier.
- Optionally, enter additional information about the notifier.
- Select a notifier type from the list. Email is currently the only option.
- Click Save.
...
- Navigate to Monitor > Notifiers.
- Hover over the notifier to be deleted.

- Click delete.
- Confirm that you want to delete the notifier.
- Notice the message confirming deletion at the top of the page.
...
Navigate to Monitor > Alert Settings. The Alert Settings page appears, showing all alert settings for all user roles.

Set Alerts to Receive
- Navigate to Monitor > Alert Settings. The Alert Settings page appears, showing all alert settings for all user roles.
- From the Role list, select the user role to which you want to send a new alert.

- Select one or more triggering events for which you want to generate an alert to people with this user role.
- Click Save.
...
When you need support, navigate to Monitor > Support and share the details there about your ESS to support personnel. You can even upload this information directly to support personnel by clicking the Upload button at the top of the page. Click the logs at the bottom of the page to get details about all recent capture and processing tasks.

View Log Files
...
- Navigate to Monitor > Support.
- Scroll down to the Log Files section of the page.

- Click on the desired log file. The file opens in a new tab. The example below shows an ESS log file.
